The unusual weather pattern for early season snowmaking that affected the Northeast in November-December 2012 returned again in 2013, raising hopes of the perfect early season. However, as in 2012, it didn’t quite turn out that way.
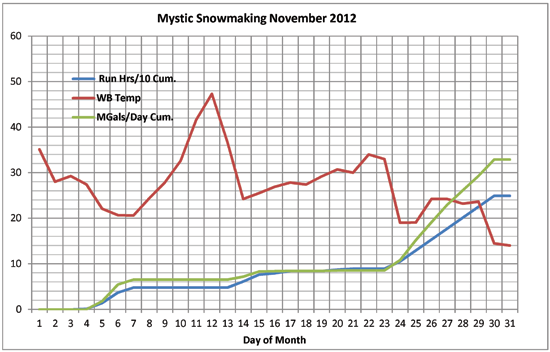
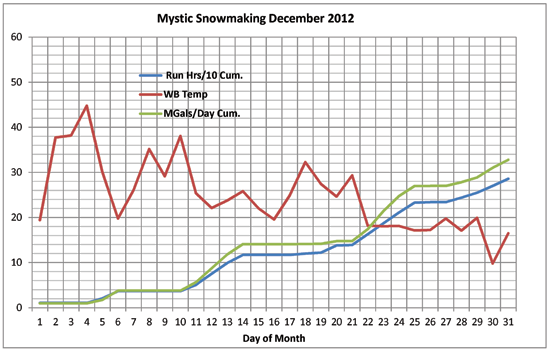
Let’s look at some recent history. The early-season weather of winter 2012-13 made for an unusual year for snowmaking, with a cold November 2012 and relatively mild December. The average temperature for November 2012 at an anonymous resort in northern New England—we’ll call it Mystic Mountain—was 27.2º F, with 249 hours of operation and a water flow output of 32.9 Mgals. The average water flow for the month was 2,200 gpm. The average temperature for December 2012 was 24.8º F, with 286 hours of operation and a water flow output of 32.8 Mgals. The average water flow for this month was 1,911 gpm. This data and performance curves were documented in a SAM special report in January of 2013. (See http://www.saminfo.com/blog/vagaries-snowmaking-fall-2011-vs-fall-2012.)


So, how did early season November-December 2013 compare with 2012? The results are surprising, as presented in the following data and accompanying charts.
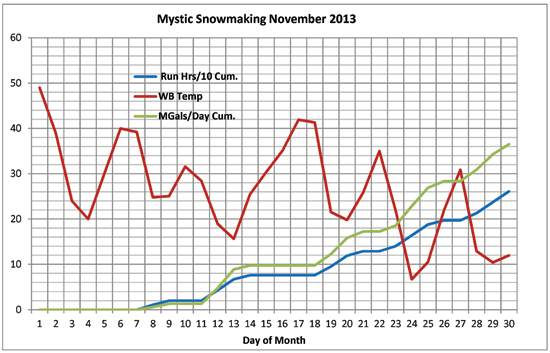
Once again, November 2013 was a very strong snowmaking month—even better than November 2012—as many areas in New England output 40 to 50 percent of their yearly water volume. Using real time data from Mystic Mountain, the average temperature was 25.5º F with 261 hours of operation and an output of 36.5 Mgals. of water. The average water flow for the month was 2,332 gpm. Most excellent! Water availability was a non-issue.

However, for the month of December 2013, the average temperature was 21.1º F, with 370 hours of operation and an output of 40.1 Mgals. of water (low water inflows hampered operating hours and output). The average water flow for this month was 1,805 gpm. This would seem like a great finish for the Christmas holiday trail counts but for a key statistical deception.

For this ski area, the average temperature for December was very close to normal, with November being about 3 degrees F below normal. However, averages are very deceptive and do not provide an accurate picture of the operating reality. Examine the data for 2013 in the charts below. Note the spiked temperature band for December 2013, and the extreme temperature swings. Note also the prolonged mid-month warm spell. This extreme pattern continued well into January and wreaked havoc with many Eastern areas.
Based on this information, we can see that the actual operating temperatures and potential run hours for December 2013 were impacted by the extreme temperature swings, meltdowns and lack of normal snow cover. Again, very good snowmaking weather in November of 2013 made a huge and important difference in snowmaking trail counts and helped offset December’s weather fluctuations, at least for this location.


