The Eastern U.S. endured some of the most trying early-season snowmaking conditions in decades this past November and December. The prolonged Indian summer of 2015 extended through November and nearly the entire month of December, much to the chagrin of ski area operators. Highly vaunted low-e snowmaking systems were cuckolded by persistent warm and marginal snowmaking temperatures, accompanied by a dearth of natural snow. Resorts were left high and dry for large chunks of November and struggled mightily into late December. The holidays, both Thanksgiving and Christmas, brought humble pie, in contrast to the relatively strong temperature conditions of the 2013 and 2014 early snowmaking seasons.
Comparative snowmaking performance numbers for the two seasons are presented below. Note that all the presented statistics are based on real time data from a resort in northern New England.
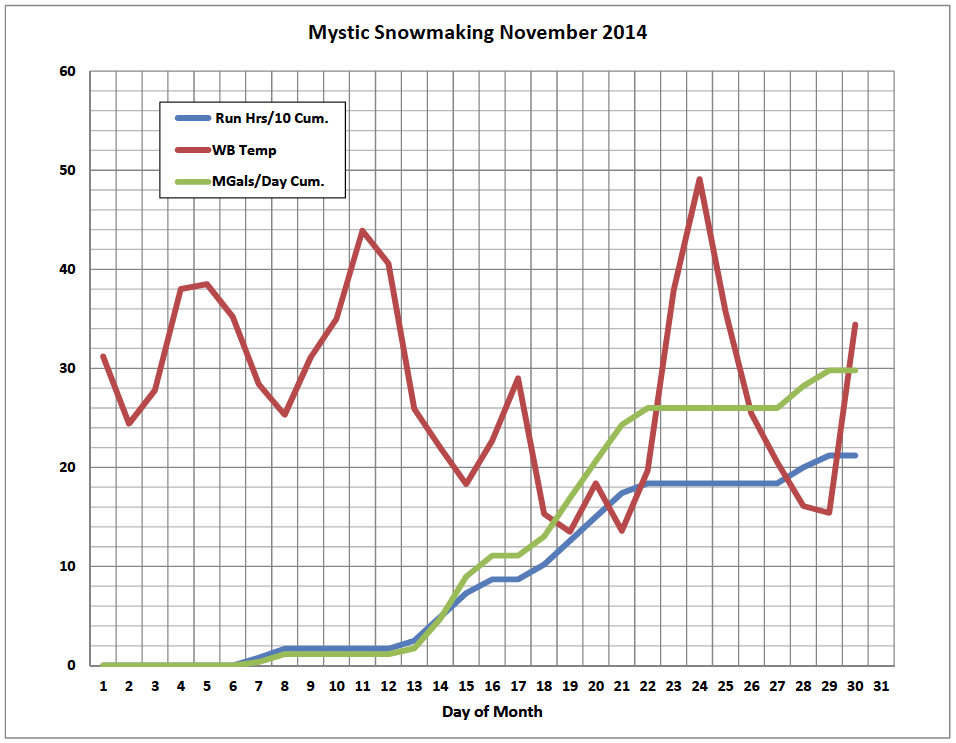
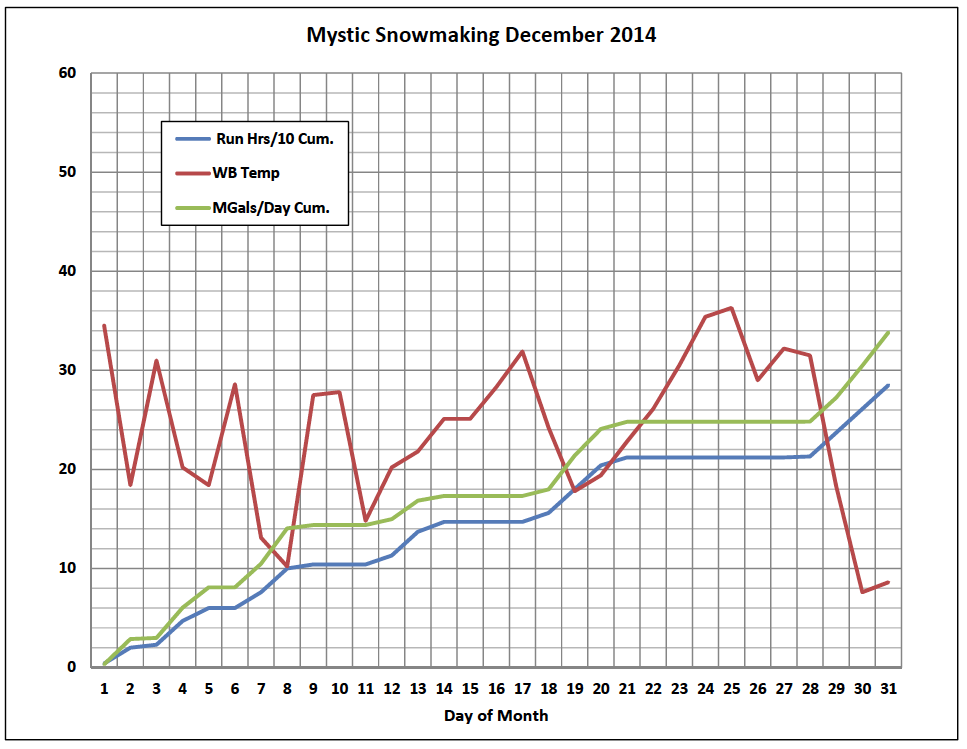
Recall that the early season weather of 2014 made for a good year for snowmaking, with a cold November and similar December. The average wet bulb temperature for November 2014 at Mystic Mountain was 26.8º F, with 212 hours of operation and water flow output of 29.8 Mgals. The average water flow for the month was 2,342 gpm. The average temperature for December 2014 was 23.8º F, with 285 hours of operation and water flow output of 33.8 Mgals. The average water flow for this month was 1,979 gpm. Water availability was an issue.

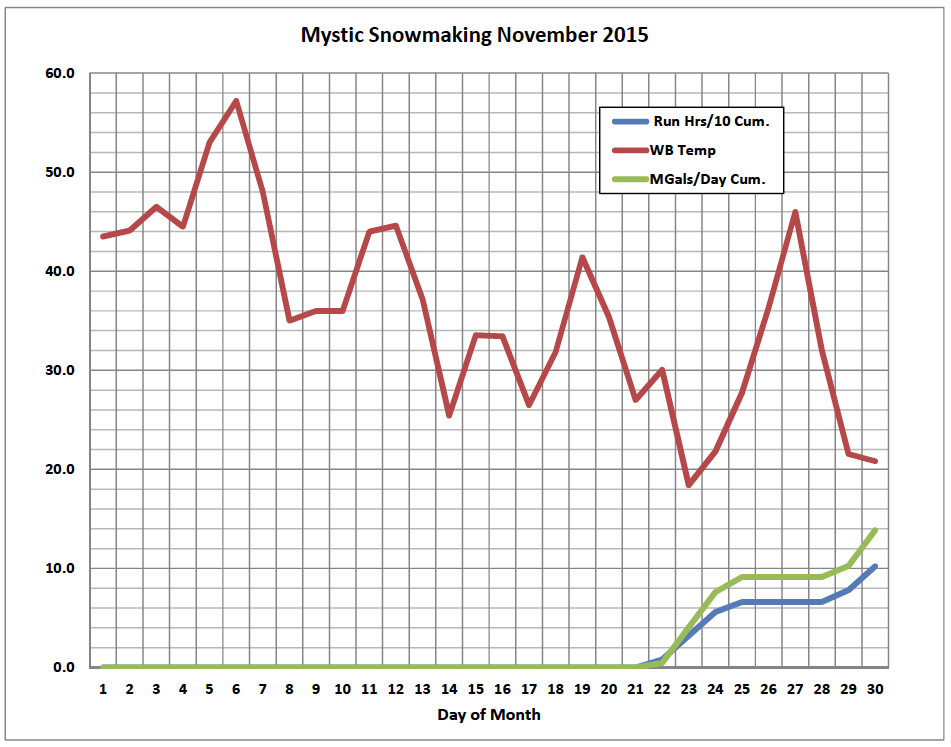
Fast-forward a year. November 2015 was a very weak snowmaking month. Many areas in New England output about 20 percent of their yearly water volume—less than half of the two prior years. Using real time data from Mystic Mountain, the average wet bulb temperature was 34.8º F (ouch), with 107 hours of operation and an output of 13.9 Mgals of water. The average water flow for the month was 2,265 gpm. A most excellent effort considering the obstacles!
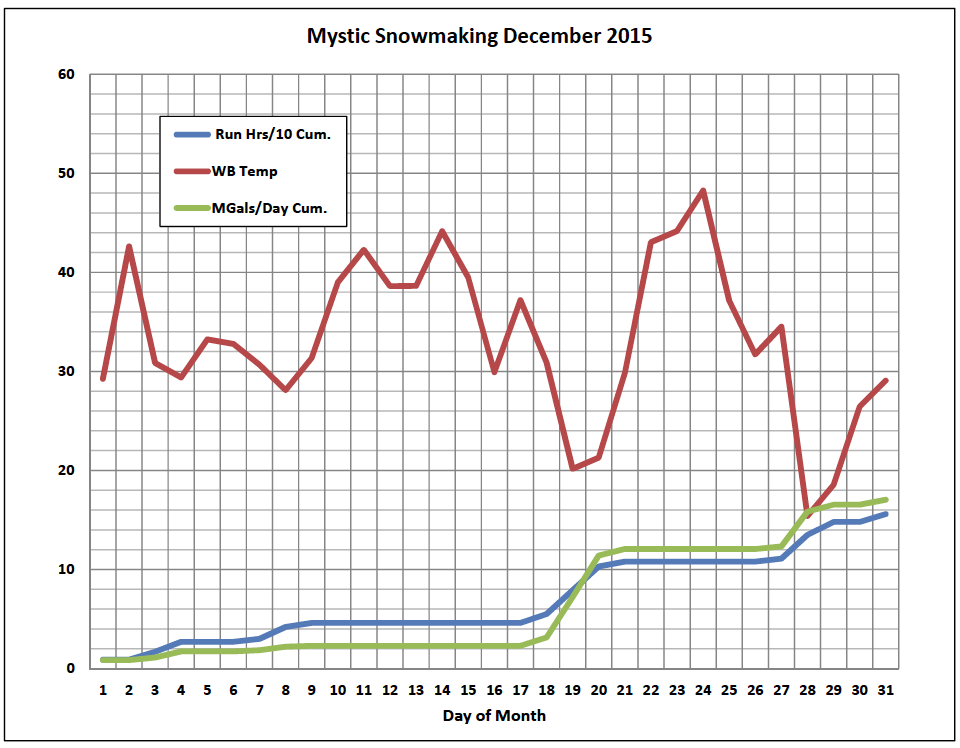
 December 2015 was nearly as bleak: the average wet bulb temperature was 33.2º F (double ouch), with 156 hours of operation and an output of 17.0 Mgals of water. The average water flow for this month was 1,805 gpm. Again, an excellent snowmaking effort considering the weather constraints.


Overall snowmaking production for November and December 2015 was less than half that of 2014. And even that output was rather remarkable, given that November’s average wet bulb temperature was 8 degrees higher in 2015, and December’s was 9.6 degrees higher!
The data starkly depict the epic temperature conditions of 2015 and their subsequent impact on snowmaking operations. The lack of natural snow was not helpful. Most areas were struggling with their trail counts well into January, and the impacts on business and revenue levels through the important Christmas Holiday period were not pretty. The repercussions in the local and regional economies are just now being felt.
On a positive note, this season can be described as a perfect storm of negative factors. The likelihood of a repeat, from a probability perspective, is very low. Weather patterns are cyclical, and extreme events will happen over a 30- to 50-year cycle. Bring on the snow, and let’s put this snowmaking season in the rear view mirror!


 A perfect storm of unfavorable conditions challenged Eastern snowmakers in November and December 2015.