


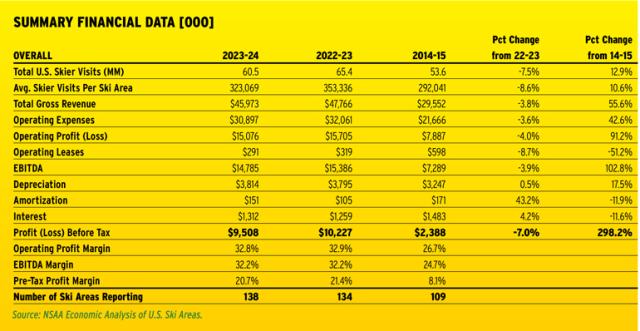
The 2023-24 season demonstrated the resilience of the U.S. winter resort industry. Overall skier visits for 2023-24 were down nearly five million nationwide, 7.5 percent less than the record 2022-23 season. According to the NSAA Economic Analysis of U.S. Ski Areas, average visits per reporting resort were down 8.6 percent, third place in the post-Covid era and only marginally better than the 10-year average. Revenues, however, remained well above pre-Covid levels, as season pass sales helped insulate resorts from the typical effects of reduced visitation.
It’s important to note that the national results across many of the metrics in the Economic Analysis are skewed by the largest resorts, which overall performed better than all other size segments. We’ll highlight these differences, as well as regional differences, throughout this review.
Visits were down in every part of the country, but results varied widely by region. The Midwest took the biggest hit, suffering from a severe weather trifecta of early season warmth, a mid-winter meltdown, and an abnormally early spring. This shortened the season for Midwest resorts by 15 days compared to 2022-23 and resulted in a 23 percent dip in visits. The Rockies fared the best, falling just short of last year’s visit total despite four less operating days.
It’s noteworthy that in terms of visits, the big keep getting bigger and the small keep getting smaller. Over the past decade, visits to small and medium ski areas have declined, while large and extra-large resorts are up 24 percent.
Pass impacts. Some of this phenomenon is explained by one of the more significant findings of the survey—the continued proliferation of season passes. For the first time since the two data points started being collected in 2019-20, season pass revenue overtook day ticket sales nationally, driven largely by the Epics and Ikons. Pass sales eclipsed day ticket sales in all regions except the Midwest and Southeast, where summer lift revenues are more prevalent.
This is a positive trend for the industry in general, as passes offer more revenue stability and protection from variations in weather compared to day tickets. In addition, most pass revenues flow into resort coffers before the ski season even starts, providing more steady cash flow throughout the year.
Anecdotally, most of my skiing friends have eschewed day tickets altogether and get their mountain access through a combination of a season pass to their “home” mountain augmented by some combination of Epic, Ikon, Indy and/or other passes to round out their season’s plan of day trips, regional overnights, and destination skiing.
Overall, it appears the model of lower-cost season passes and high window prices is the new normal.
Long-term questions. While competitively priced season passes are great for core skiers, I worry about whether the trend of high day-ticket prices will adversely affect industry growth over time. According to the 2023-24 Kottke End of Season & Guest Experience Study, the average weekend lift ticket price is now $198. Are we beginning to price non-core participants out of the sport?
At present, season passes have a strong perceived value, even though, in aggregate, skiers are paying more than ever to access resorts. If this value perception erodes over time, the industry could find itself in an unenviable position where its customers find the pricing of both passes and tickets cost prohibitive.
Operating Results
Despite the weather-related dip in visitation, operating results were impressive. Average total gross revenue of $46 million was off 3.8 percent from last year, but still 21 percent better than any pre-Covid season. Total annual revenue per skier visit jumped to a record $142.50, again bolstered by season pass revenue—which is not directly tied to an individual visit, thus improving per skier income when visits are down.
West leads the way. The Economic Analysis notes that most of the growth trajectory has been driven by Western resorts, which have nearly doubled their sales in the last decade, beating inflation by a combined 68 percent. East of the Rockies, in the Northeast, Southeast, and Midwest, resort sales have only increased by a combined 18 percent during that same period, just a little more than half the rate of inflation. (That said, the Midwest achieved growth of 46 percent in the past decade, and until last year, the Midwest’s revenue growth had outpaced Rockies resorts.)
But there are other ways to understand the data. The growth rates presented in the growth by region line chart above offer a useful perspective.
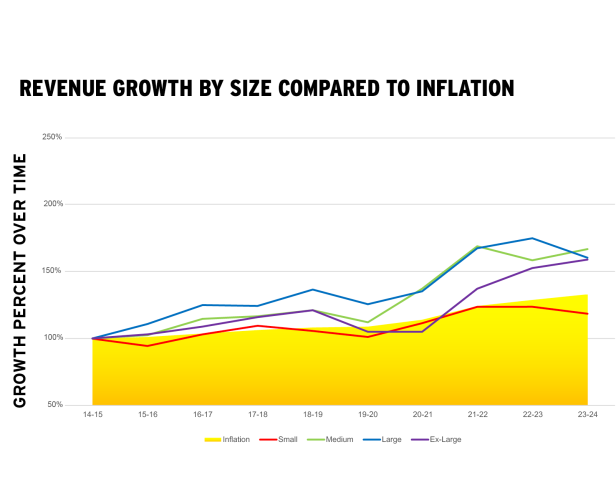
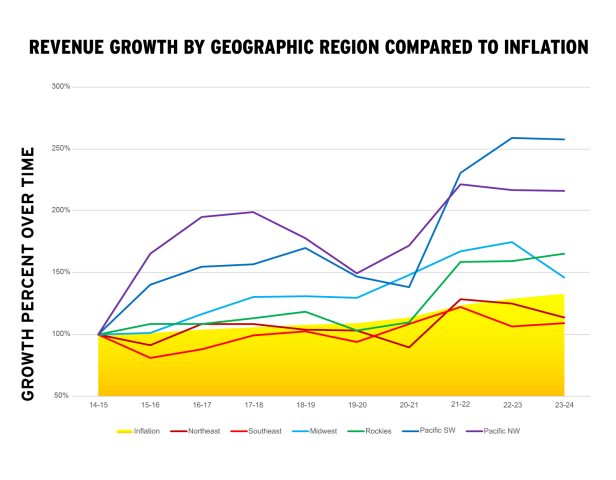
The line graphs above demonstrate that most size groups and regions have prospered in the past decade. Sources: NSAA Economic Analysis of U.S. Ski Areas; Consumer Price Index.
We should note that while the Pacific regions appear to have extraordinary results, the survey numbers for these two regions are small and thus are susceptible to wide variation from year to year. The Pacific Northwest, for example, included just eight resorts in 2023-24—and just five in 2014-15.
Results for revenue by resort size (see top chart, above) show that medium- to extra-large-size resorts all saw a similar rate of growth over the past decade and stayed ahead of inflation. However, the smallest resorts saw growth stall and decline in the past two seasons and fell behind the rate of inflation.
Other departmental revenues held their own, with only modest changes over the past few years. Snowplay and tubing increased both in gross revenue and per visit, as did lessons. Accommodations and food and beverage both slipped a bit, perhaps due to the change in the mix of day skiers and pass holders.
Expenses and EBITDA trends. Expenses were down 3.6 percent year over year, matching the decrease in revenue. There were some items that increased notably by percentage, especially the cost of insurance, power, and fuel. I would expect these to be problem areas for several years to come.
EBITDA, which measures profit margins without considering taxes or debt, remained even by percent compared to the prior year and is a full 18 percent better than any year prior to 2020. In pure dollar terms, EBITDA declined for the third consecutive year. This is a trend worth watching as expense pressures continue to rise. Similarly, profits per skier visit rose 1.7 percent, continuing to climb to $29.43, but in dollar terms declined in each of the past three years.
Skewed by Size
The survey overall remains skewed by results from large and extra-large resorts. In 2023-24, nearly 46 percent of survey participants were owned by one of the major conglomerates or resort holding companies. This is especially true in the West, where half the resorts surveyed are operated by multi-resort ownership.
Smaller independent operators should use discretion on which numbers are relevant to their operations. Independents can compare how they stack up in measures such as sales by department, revenue per skier visit, and department margins, but big-ticket overhead expenses in the survey, such as marketing, administrative costs, and debt structures, are going to reflect more efficiencies in corporate income statements and balance sheets. The Excel workbook that accompanies the Economic Analysis offers better comparisons (see box, below).
When I studied these numbers for my small/medium resort, I would concentrate on how my revenue per visit by department, my departmental costs and margins, and my balance sheet health compared to my peers, and always compared my own results year over year.
Balance Sheets Show Strength
Bankers are big on balance sheets. At any moment in time, they provide a snapshot of a business’s health. Is there enough cash to pay the bills? Are profits being reinvested wisely? Are owners increasing the value of their businesses? Looking over a period of years, balance sheet comparisons can spot important trends that highlight whether a business is doing better or worse.
Over the past five years, the industry has improved and/or stabilized balance sheet performance impressively. Balance sheet health correlates directly to strong income statement management over time, and all balance sheet metrics have improved because of the past three years of strong performance.
Current ratios (current assets divided by current liabilities) remained solid at 1.6 percent. Only the Midwest had a ratio under one. This indicates an ability to keep up with short-term obligations.
Long-term debt ratios continue to improve, dropping to 13.8 percent of assets compared to 19.2 percent just five years ago. Medium-sized resorts lag the field in this measurement, but they also boast the largest improvement over the past decade, recovering from a stifling debt ratio of 58.9 percent in 2015 to a manageable 19.2 percent in the most recent survey.
Net worth measures the owners’ value in their business. It consists of what has been invested (capital dollars and/or stock) and what profits have accumulated over time (retained earnings). This is also commonly called the equity position. Net worth remained strong nationally and in most regional categories. Equity share of assets held at more than 80 percent in small and large resorts and over 65 percent in medium and extra-large resorts nationally. The only significant outlier was the small West Coast areas, where equity was less than 35 percent of assets.
A strong equity position is important for resorts to support the ability to grow over time. Strong retained earnings give operators the courage to expand operations and/or maintain their existing infrastructure, particularly assets that generate incremental income.
Summer Operations
Summer operations remain a vital component of resort operations, with 79 percent of all survey respondents involved in some sort of summer activity. Overall summer operations accounted for 11.4 percent of resort revenues in 2023-24, a slight decline compared to the recent past.
Mixing it up. While overall summer revenue hasn’t changed significantly, the mix of activities has changed over the past decade. For example, when we first opened the Summer Adventure Park at Gunstock in 2011, resorts throughout the Northeast and indeed nationwide were scrambling to add summer attractions to their menu of activities, including zip lines, ropes courses, and other aerial adventures. While still a strong summer ops component, their importance has been diminished compared to other offerings such as golf, mountain biking, and chairlift rides, which have become the leading revenue generators.
Lodging, food and beverage, and wedding operations remain significant. This makes sense, as these activities utilize existing amenities at the resort, add off-season income, and employ additional year-round staff.
The bottom line here is that each resort has unique facilities, landscapes, and other complementary summer economies in its geographic area. It’s not as important what a resort does for summer operations as it is that it does something to create a year-round economy for itself.
Post-Covid Headwinds
In my side gig as a director at Bank of New Hampshire, I have studied the effects of the pandemic and the subsequent economic stimulus a lot. Think about the post-Covid surge from a broader perspective:
When the government shutdown first went into effect, the world as we knew it changed overnight. The federal government acted swiftly and strongly to fend off a collapse of the economy by giving trillions of dollars to businesses and individuals in a brief period, boosting balance sheets and bank accounts. While some of this money was used to survive the quarantine period and business interruption, a good part of it was left over after restrictions were lifted.
The Covid bump. By 2021, consumer savings reached an all-time high and credit card debt fell to near record lows. Businesses embraced the work-from-home model, leading many people to flee from cities to more rural areas, many of which, coincidentally, were closer to ski resorts. At the same time, ski resorts began to perfect their online presence in conjunction with RFID lift access and cashless payment methods.
Once restrictions were lifted the ski industry exploded. Visits eclipsed 60 million for the first time in 2021-22 and have stayed there despite adverse weather conditions. Resort revenues, both on a total dollar and per skier visit basis, set new all-time highs. Revenue increased a whopping 36.5 percent in 2021-22, illustrative of healthy discretionary spending fueled by “Covid cash.” That trend decreased only slightly in the two following years.
Back to normal? However, in 2025, the consumer financial profile looks vastly different. Covid money has been spent. Savings rates are falling rapidly, and credit card debt is skyrocketing, now over a trillion dollars. Credit card delinquency is nearing record territory. Interest rates are significantly higher and show no signs of falling in the near term.
While consumer spending remains strong for now, tightening credit, continued high interest rates, and persistent inflation could push many households closer to the edge. I don’t think the sky is falling, but the industry should take note that some air may be leaking from the balloon created by the Covid economic stimulus. EBITDA has eroded for three straight years. It is still strong, but not trending in the right direction.
There will be a lot of economic uncertainty in the next few years as the effects of tariffs, monetary policy, interest rate manipulation, and a new social agenda promulgated by a new administration plays out. The industry has gained a lot of ground in the last four years. It remains very healthy and has created a sustainable business model. But it will take continued diligence, particularly in expense management, and a continued focus on non-lift income streams to keep from taking a step back.
A Note on Regional/Size Comparisons
The Economic Analysis includes a separate set of Excel workbooks that contain all tables featured in the report and supplemental tables, with size groupings tailored specifically to each region. The Economic Analysis says these customized regional size breaks were created after careful deliberation to identify the most “natural” size breaks for each geographic area. This is intended to make “by size/region” comparisons more useful.
In these separate Excel workbooks, the Northeast has four size groups, and the Rocky Mountain region three. The Midwest and Southeast each have two size groups. Due to their sample sizes, the Pacific Southwest and Pacific Northwest are presented in a customized grouping, with small ski areas from both Pacific Southwest and Pacific Northwest in one group, medium and large ski areas in the Pacific Southwest in two separate groups, and large ski areas in the Pacific Northwest in a fourth breakout.