Most ski areas today compete primarily on the basis of the guest experience, rather than product or price. This is a significant change that has been occurring over the past two decades. To increase competitiveness, you should use post-visit survey data to determine which aspects of your guest experience—both rational and emotional—have the greatest impact on satisfaction and loyalty. By focusing more time and resources on what your guests want, you can significantly enhance the overall guest experience, thereby increasing repeat and referral business.
Many businesses and marketers have recognized the importance of the guest experience, not just winter resorts. Harvard Business Review calls it “the latest competitive battleground.” That’s because “customers are no longer buying products and services—they are buying experiences delivered via the products and services,” says Gregory Yankelovich, co-founder of Grapevine Marketing
Solutions, a data-driven sales and marketing firm.
Question is, what exactly makes for a great experience?
Expanding the Definition of “Guest Experience”
When we introduced our Net Promoter-based survey system to the ski industry nearly 18 years ago, the “guest experience” was defined as the on-mountain experience. Since then, what constitutes the guest experience has expanded to include the broader experience, from pre-arrival through post-departure touchpoints and ongoing marketing communication. It even includes uncontrollable problems the ski area is not responsible for, such as weather, airplane delays, and lost skis and baggage.
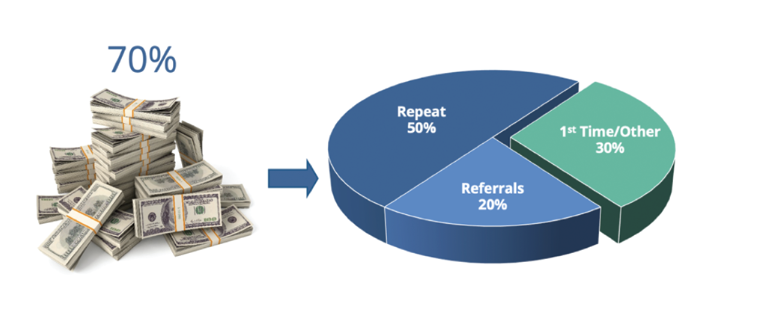
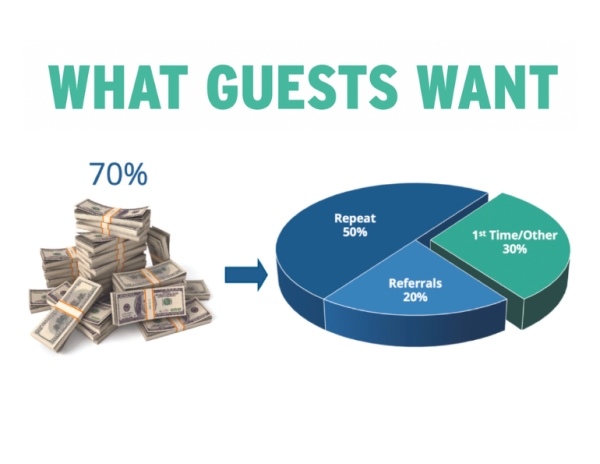
This change stems from the realization that the overall guest experience—not just the on-mountain experience—drives satisfaction and loyalty, which in turn drives repeat and referral business. And that’s extremely important: repeat and referral business represent 70 percent or more of a ski area’s revenue.
The more satisfied and loyal your guests are, the more often they will visit you, the more they will spend with you per visit, the more often they will recommend you to others and write more positive reviews, the more likely they will be to provide constructive feedback, the more accepting they will be of price increases, and the more they will lower the cost to service. For these reasons, the customer experience has in recent years been referred to as the “new marketing.”
The importance of the guest experience has led the National Ski Areas Association (NSAA) to rename its national demographic survey the “NSAA 2023/24 National Guest Experience & Demographic Study.” (For more thoughts on the survey and trends in guest satisfaction and loyalty, see “Is Lower Guest Satisfaction & Loyalty the New Normal?” SAM, May 2024.)
 Focus on the overall guest experience because satisfaction and loyalty drive referrals and repeat business, which account for 70 percent of a ski area’s revenue. Source: Guest Research, Inc.
How to Measure the Guest Experience
What guest experiences should you be measuring in your guest surveys? Start with the three most popular overall measurements of the customer experience used by corporate America, namely, the Net Promoter Score (NPS), Customer Satisfaction Score (CSAT), and Customer Effort Score (CES).
Three key measures. Applied to the ski industry, NPS asks guests their “likelihood to recommend” the ski area, while CSAT asks guests their “overall satisfaction” with their most recent visit. These two are the most important outcomes. At a minimum, all ski areas should be tracking NPS and CSAT as overall measurements of the guest experience.
CES, which measures the ease of doing business with an organization, is best used to measure specific transactions, such as ease of navigating the ski area’s website, ease of making an online booking, and ease of getting from the parking lot to the first lift.
NSAA has been measuring the Net Promoter Score in its national demographic survey for more than a decade and last fall added the “overall satisfaction with visit” question to its 2023-24 survey. Since these two metrics do not explain why the ratings for these two outcomes are earned, the NSAA survey, and those for most ski areas, typically ask numerous other questions to identify strengths and weaknesses in the ski area’s touchpoints and the drivers or determinants of those outcomes.
Emotional impacts. Until recently, these additional questions have largely been about rational or functional satisfaction, such as overall cleanliness, overall lessons, quality of grooming, and overall food & beverage. But these don’t tell the full story. According to management consulting firm McKinsey, “70 percent of buying experiences are based on how the customer feels they are being treated.”
So, lately, resorts have added questions to measure guests’ emotions and emotional engagement (for more on this new frontier in guest experience research, see “How Does That Make You Feel?” SAM, March 2024). Examples of such questions include the level of fun, happiness, family appeal, and being treated as a valued guest.
 NPS, CSAT, and CES are the most popular measurements of the customer experience used by corporate America. Source: Guest Research, Inc.
Discovering What’s Important to Your Guests
There are innumerable touchpoints that affect, in varying degrees, guests’ likelihood to recommend the ski area they visited and overall satisfaction with their most recent visit. If you know which touchpoints have the greatest impact on the guest experience, you can allocate resources to enhance those priority drivers or determinants of guest satisfaction and loyalty. The drivers may differ somewhat for satisfaction and loyalty, and they may differ from season to season and even during the season.
To identify the drivers, we at Guest Research have used a variety of statistical analyses, including correlation, regression, and CHAID (i.e., decision-tree) analyses. The least complex of these, and the easiest to understand, is correlation analysis. For this reason, we have embedded a correlation calculator in our online management reporting systems available to our clients. Correlation calculators can also be accessed on the internet.
Measuring correlations. While not implying causation, correlations measure the association or strength of the relationship between two variables, e.g., “overall staff friendliness/helpfulness” (the independent variable) and “likelihood to recommend” (the dependent variable). The dependent variable is “dependent” on the independent variable.
The higher the correlation coefficient (on a scale of 0 to 1.0), the stronger the relationship. A correlation coefficient of 1.0 is a “perfect positive correlation.” For example, with a correlation coefficient of 1.0, as individual survey respondents move up or down the rating scale for staff friendliness/helpfulness, they would make identical changes up or down in their ratings for overall likelihood to recommend. A coefficient of 0, on the other hand, would indicate that there is no association between the ratings of the two variables.
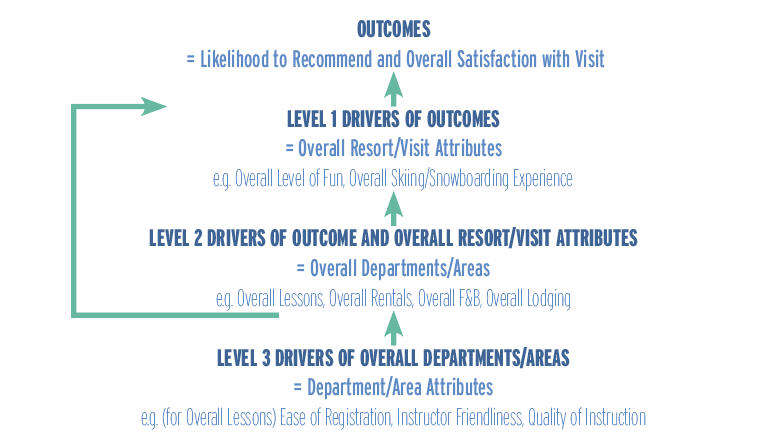
Typically, the highest correlations with likelihood to recommend and overall satisfaction are for the overall resort/visit attributes (including emotional loyalty), followed by the overall departments/areas, and then followed by the department/area attributes. Note, though, that the “overall” attributes are the result of guest interactions with the resort’s various departments and employees. The overall ratings are the sum of many specific experiences across the resort.
 Measure correlations between variables to identify drivers. Source: Guest Research, Inc.
Correlations that matter most. We have found that correlation analysis should be conducted at all three levels, starting from the top or most inclusive level, as shown in the graphic below.
Once the correlations have been calculated at each level, we suggest prioritizing them at each level. Priorities should be based not only on their correlations with the two outcomes, but also on whether their ratings have declined significantly year over year, and whether they are significantly lower than the competitive set’s. In other words, priorities should include those attributes with high correlations whose ratings have declined year over year or are significantly below the competitive set’s.
For an even deeper dive, correlation analysis can be conducted on different guest segments, first-time and repeat guests, generations, income levels, day and overnight guests, ability levels, and household composition. This analysis should be done on the priority attributes, once those priorities are determined.
Net Promoter® and NPS® are registered trademarks of Bain & Company, Inc., NICE Systems, Inc., and Fred Reichheld. Net Promoter ScoreSM is a service mark of Bain & Company, Inc., NICE Systems, Inc., and Fred Reichheld.


