During the 2022-23 season, the United States ski industry experienced record western snowfalls that drove a surge of visitation at large and extra-large Western ski areas, resulting in a new industry record of 65.4 million skier visits. Despite inconsistent weather elsewhere in the U.S., visitation remained strong, buoyed by investments in snowmaking and grooming.
While skier visits are an important measure of industry health, revenue and profitability are the measure of business success. Each region experienced relatively varied results in this respect, according the “2022-23 Economic Analysis of United States Ski Areas.”
Expenses trimmed profits for many. Midwest ski areas saw 5 percent revenue growth, allowing for a similar level of profitability as the benchmark 2021-22 season. Northeast ski areas experienced a 3 percent revenue decline and a 3 percent increase in expenses, contributing to a 15 percent reduction in profitability over 2021-22 results, but still well above the 2015-16 to 2020-21 average. The Southeast endured a weather-related 15 percent decline in revenues and a 50 percent decline in profitability, but profitability remained above the 10-year historical average.
Rocky Mountain revenues were essentially flat with 2021-22, while expenses increased 10 percent, reducing profitability 10 percent year-over-year. In the Southwest, revenues were up 13 percent, but a 25 percent increase in expenses negated any profitability gains. Pacific Northwest profitability fell 23 percent due to a 2 percent drop in revenues and a 13 percent rise in expenses. The expense and profit results in these western regions can in some measure be attributed to extraordinary snowfall and the associated expense of maintaining winter operations.
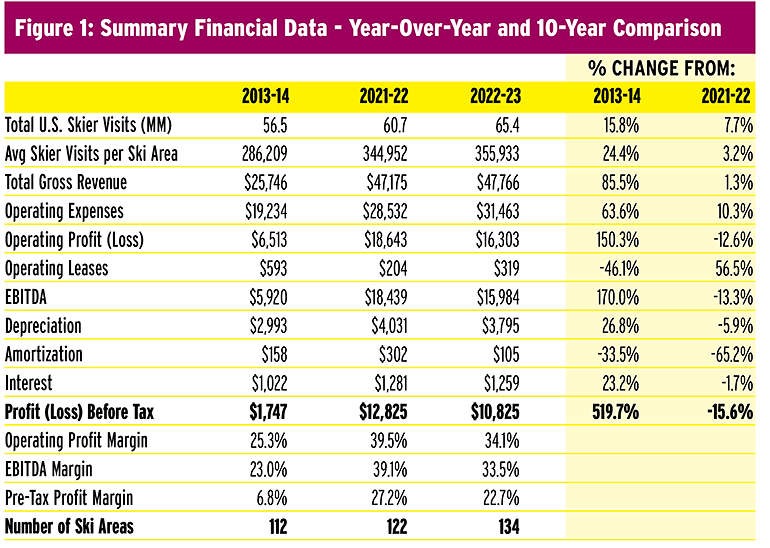
 Record-breaking skier visits suggest industry health while increased expenses trimmed 2022-23 profits. Source: NSAA / Economic Analysis of U.S. Ski Areas.
THE WEATHER FACTOR
For decades, the ski industry was at the mercy of storm cycles (or lack thereof) and weather events, impacting both the on-snow experience and length of season. In recent years, these weather events have become more extreme. However, constant investment in snowmaking technology over the last 20 years has helped reduce—but not eliminate—weather dependency, resulting in the number of winter operating days remaining consistent over the past 10 years.
Operators have demonstrated time and again their ability to overcome Mother Nature’s fury, but not without Herculean efforts and accompanying stress levels. While we collectively celebrate the financial success and strong demand of the past two years, we owe a debt of gratitude and recognition to the people who prepare and deliver the on-snow experience that is the essence of our sport.
CONSOLIDATION CONSIDERATIONS
Before taking a closer look at the numbers and trends in the 2022-23 economic study, I offer an observation around a meaningful change in the industry and this study over the past decade.
The U.S. ski areas owned by Vail Resorts (34) and Alterra Mountain Company (14) that consistently participate in the annual economic survey combine to represent 31 percent of respondents in the 2022-23 survey, and account for nearly half of the total annual skier visitation in the U.S. More importantly, Vail Resorts (Epic) and Alterra (Ikon) are strategically committed to season pass sales as their primary ticket revenue driver, contributing more than 70 percent of their respective lift ticket revenues. It is estimated that these two companies currently sell a combined four million season passes annually.
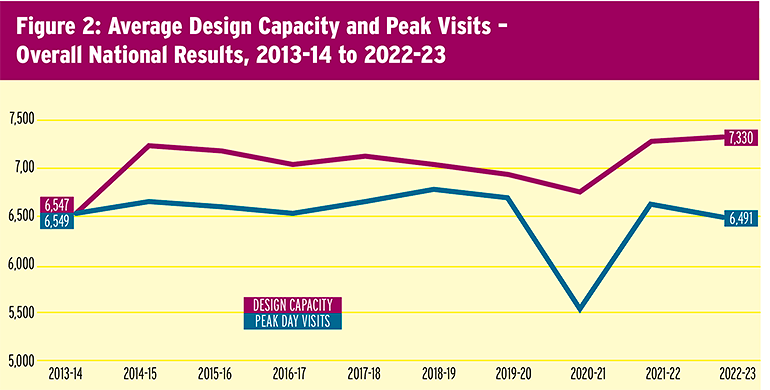
 Despite complaints of crowding, industry peak day visitation remained largely flat and below design capacity. Source: NSAA / Economic Analysis of U.S. Ski Areas.
How conglomerates skew results. Given the several billion dollars in annual revenues generated by the season-pass strategies of the two giants, the calculation of season pass ticket revenue to their respective individual ski areas for this economic analysis can fluctuate from year to year based on scan rates and specific ski area season pass utilization. This differs from an individual ski area’s season pass sales revenue, which is captured entirely within its own ticket revenue totals.
The other shifting dynamic related to the results in the study is that Vail Resorts and Alterra, as well as other multi-property owner/operators, such as POWDR, Boyne Resorts, Mountain Capital Partners, and Pacific Group Resorts, Inc., have a centralized model for many of their SG&A functions (accounting, finance, legal, insurance, marketing, mountain and strategic planning, and HR) that creates synergies and increases sophistication. Breaking out precise SG&A costs to the individual ski areas is difficult, though, and it is clearly more productive for those organizations to look at individual ski area performance with SG&A as a below-the-line consideration.
You should consider these factors as you review the data in the economic analysis report, especially when comparing ski area performance within your competitive set, as well as industry wide.
ASSESSING THE DATA
The 2022-23 economic survey survey saw increased participation with 134 ski areas providing data, up 10-20 percent over 10-year participation rates. With 480 ski areas operating in the 2022-23 season, this represents a 28 percent industry participation rate.
However, survey results continue to be over-represented by medium, large, and extra-large ski area data, which potentially overstates industry metrics. The reality of this overweighting fails to represent the results of smaller ski areas, who do not have the benefit of volume to drive efficiencies and margin.
Wanted: more small-area participation. Increased small ski area participation in the annual economic survey would provide meaningful data to those operations to measure and strengthen their operating performance. That data would be highly informative, as small ski areas play a critical role in creating skiers and snowboarders that benefit the broader industry.
An interesting aside, 225 ski areas reported their total skier visits for the “2022-23 Kottke End of Season Report.” Perhaps as many as 75 small ski areas were represented in that survey sample. A similar participation rate by small ski areas in the economic analysis survey would provide that cohort with useful data and insights.
REVENUE AND EXPENSES
Record visitation of 65.4 million in 2022-23 was an impressive follow-up to the previous record of 60.7 million visits in 2021-22. Plus, according to the “2022-23 National Demographic Study” (part of the Kottke report), the number of individual ski and snowboard participants in the U.S. surpassed 11 million for the first time ever.
The upside. The all-time high visitation and participation are reflected in the financial results of the 2021-22 and 2022-23 seasons. Measuring against the established and relatively consistent five-year historical performance baseline (2016-17 to 2020-21), gross revenues the past two years were up a remarkable 30 percent, with EBITDA up nearly 50 percent over this same five-year baseline period and a whopping 170 percent from a decade ago.
The industry has never experienced this level of skier participation or revenue and profitability growth in its multi-decade history.
The downside. One note of caution: Operating expenses were up 30 percent compared to the same five-year baseline, and rose for the second year in a row in 2022-23, by 10.3 percent, driven by insurance, utilities, inflationary increases in goods and supplies, and wages. Growing expenses will be a continuing challenge to manage in future years.
The 7.7 percent increase of 4.7 million visits in 2022-23 did not translate into a large increase in revenue, which grew a modest 1.3 percent ($591,000, or 13 cents of incremental revenue per visit on those 4.7 million visits). The modest revenue growth and greater operating expenses contributed to a 15.6 percent decline in operating profitability before tax compared to the record 2021-22 profitability.
Increased season pass utilization was the contributing factor to this skier visit increase. Greater season pass visitation impacts margins, which is the trade-off for season pass revenue predictability.
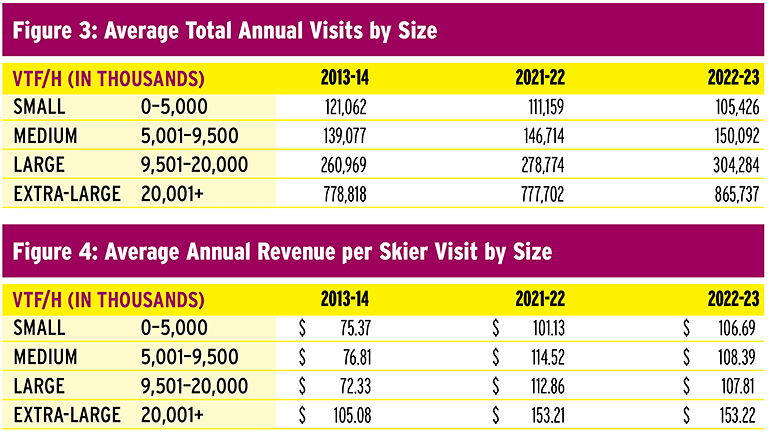
 Extra-large ski areas’ average annual visits and revenue per skier visit are dramatically higher than the rest of the industry—evidence of their underlying season pass strategies. Source: NSAA / Economic Analysis.
The long view. On a more upbeat note, as a clear sign of industry health, profit before tax was up 5x from 2013-14, significantly driven by large and extra-large ski area 10-year EBITDA CAGRs (compound annual growth rate) of 11.7 percent. In comparison, small and medium ski area CAGRs were between 2 percent (Southeast) and 5 percent (Midwest).
LIFT REVENUE ON THE RISE
Lift revenue accounts for 52 percent of total revenues, making it the fourth straight year that lift tickets and passes have accounted for more than half of total revenues, a good indicator of industry strength. Day tickets (winter and summer) still account for a majority of total lift revenue, with season pass sales reflecting 46 percent of total lift revenue. Ancillary revenue growth continues its recovery post-Covid and represents the remaining 48 percent of total revenues.
Season pass revenue continues to grow as a percentage of total lift revenue. This trend is beneficial on many levels. As operating expenses and infrastructure investment costs increase at double digit rates, growing season pass revenues (a subscription model) provides a level of revenue certainty with respect to cash flow timing, weather dependency/impacts, and a critical floor of customer visits that assists with business planning and staffing. Many ski areas are currently seeing season pass revenue of 70 percent or more of total lift revenue.
The risk in high day ticket prices. Part of the strategy to increase pass sales is window ticket pricing that encourages season pass or advanced lift ticket purchases. This window ticket pricing strategy has increased season pass volumes but, in some instances, has far out-paced inflation with significant one-day ticket pricing potentially limiting spontaneous guest visitation. This also poses a risk that skiing is perceived as too expensive by the casual participant and prohibitive by potential new skiers. Unfortunately, the media, infrequent skiers, and potential new participants focus on the price of the single-day lift ticket to the detriment of the sport.
ANCILLARY REVENUE
Snow play/tubing saw revenues grow more than 42 percent in 2022-23, with the primary beneficiaries being small- and medium-sized ski areas. The latter averaged more than $1 million in revenue with strong margins. Smaller areas also enjoy higher than industry average rental shop utilization and F&B penetration.
Revenue stability/growth for small ski areas is critical, particularly in an increased cost environment, and the profit margins of these three revenue centers are major contributors to the overall profitability of small areas where ancillary revenue exceeds lift ticket/pass revenue.
The cost of high prices. Lesson revenue continues to grow, driven by private-lesson pricing. However, lesson participation has declined over the last decade, suggesting price sensitivity that potentially impacts the industry’s ability to maintain overall participant numbers (11 million) and another barrier to attracting new participants to the sport.
Lodging revenues were down marginally in 2022-23 from last year’s 10-year high as a result of lower occupancy. Continued Covid-period pricing (significantly higher room rates) and economic uncertainty are a contributing factor to lodging occupancy that has not returned to pre-Covid levels.
Summer revenues, primarily from scenic lift rides, mountain biking, on-mountain activities, and events (weddings, family reunions, concerts) continue to grow modestly and represent 11.9 percent of annual revenue.
An interesting aside, interest expense has remained flat over the past three years, and given the significant increase in interest rates over the past 24 months it is a positive that the industry has not been meaningfully affected by interest rate increases.
CAPACITY APPEARS OK, EXCEPT ...
Despite the consistent complaints on social media regarding crowding on peak days, industry peak-day visitation is virtually flat over the past decade, including at large and extra-large ski areas. The Rockies and the Southwest (California) have the largest design capacities, and as a result, the Rockies have experienced 21 percent seasonal skier visitation growth over the past decade. The Southwest (California) has experienced meaningful seasonal skier visitation growth over that same period, primarily through extended length of season (May and June operations in significant snow years).
Large and extra-large ski areas have invested in both increased uphill lift capacity and additional terrain the past decade, with skier utilization of comfortable carrying capacity relatively unchanged in the 50 percent range.
Off-hill woes. While these large and extra-large areas have increased uphill capacity and terrain, base/community infrastructure (traffic/parking) has not grown to match these increases, creating negative guest satisfaction that ski areas and communities will have to address.
BOTTOM LINE
The 2021-22 and the more recent 2022-23 ski seasons have set new industry benchmarks for visitation, revenues, and profitability, demonstrating the vitality and viability of the sport and the industry.
Weather dependency and weather impacts were in full force in the first 50 days of the 2023-24 winter season, and very few ski areas were immune to visitation and revenue shortfalls. The 2023-24 economic analysis will most likely show results below the 2021-22 and 2022-23 benchmarks, but within the historic five-year 2015-16 to 2020-21 numbers, confirming industry resiliency in a weather challenged season.
Bill Jensen has led several of North America’s top resorts during his career, including Vail Mountain, Colo., and Whistler, B.C. He was inducted into the U.S. Ski and Snowboard Hall of Fame in 2018.


